

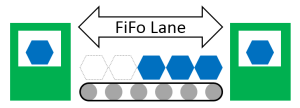
 En mi publicación anterior, discutí cómo determinar el tamaño de su carril FiFo: la fórmula de FiFo. Mi método preferido sigue siendo una estimación experta. Sin embargo, si está interesado en las matemáticas, aquí hay una pequeña calculadora de JavaScript que estima un tamaño de FiFo para dos procesos. Para obtener instrucciones sobre cómo usarlo y algunos antecedentes, consulte a continuación. La calculadora requiere JavaScript y es posible que no funcione con algunos navegadores web más antiguos. Si no ve gráficos a continuación, intente con un navegador diferente.
Información sobre los dos procesos
Ingrese la información sobre la media y la desviación estándar de los dos procesos en los campos a continuación, utilizando una unidad de tiempo de su elección. Puede pasar el mouse sobre los campos de entrada para obtener información adicional.
| Media | Desviación Estándar | |
| Proceso 1: | ||
| Proceso 2: | ||
| Tiempo mínimo para cubrir averías: | ||
Hora prevista del sistema
Muestra la relación entre la longitud de FiFo y el tiempo total esperado entre las partes del sistema.
Recomendación de tamaño de FiFo
Algunas observaciones adicionales
[post_relacionado id="365"]Probabilidades de cuello de botella
Muestra la probabilidad de que uno de estos dos procesos sea el cuello de botella temporal. Cuanto más grande sea el FiFo, más probable será que el proceso general más lento sea el cuello de botella.
Distribuciones normales
Muestra las distribuciones normales de los dos procesos. Cuanto más cercanas estén las distribuciones y cuanto más se superpongan estas distribuciones, más capacidad de FiFo se necesita para lograr el mismo rendimiento.
Cómo usar la calculadora fifo
El siguiente programa calculará el efecto de la capacidad de un carril FiFo (o, para el caso, también un buffer aleatorio) en estos dos procesos. Este programa es más útil para calcular la longitud de FiFo antes y después de los cuellos de botella. Para obtener más información sobre los cuellos de botella, vea mis publicaciones relacionadas con los cuellos de botella, especialmente el Paseo del cuello de botella. Para una discusión general sobre cómo funciona FiFo, consulte teoría y práctica en fifo Lanes. Para obtener información sobre los cálculos, consulte Determinación del tamaño de su carril FiFo: la fórmula de FiFo.
Necesitaría información sobre el tiempo entre partes para cada uno de los procesos individuales, tanto la media como la desviación estándar. Esto significa recopilar datos directamente de sus procesos (o hacer suposiciones realmente buenas). Tienes dos opciones aquí:
Verá que cuanto mayor sea la capacidad de FiFo, más rápido será su sistema. Sin embargo, un FiFo demasiado largo hará que su sistema sea menos ágil, por lo tanto, necesita una compensación. La calculadora también sugerirá una compensación. En cualquier caso, todos los cálculos a continuación son solo estimaciones. Si cree que los resultados son extraños, use su sentido común o el sentido común de alguien familiarizado con el sistema.
Sobre la calculadora
La calculadora usa las ecuaciones en Determinación del tamaño de su carril FiFo - La fórmula FiFo para estimar la probabilidad de cuello de botella. Se usaron ecuaciones similares para estimar la velocidad conjunta esperada del sistema, donde la probabilidad de que el proceso A tenga un cierto tiempo de ciclo se combinó con la probabilidad de que el proceso B sea mayor que este tiempo de ciclo y el valor esperado correspondiente del proceso B. Este último La parte es un poco compleja e involucra integrales dobles.
Calcular la función de error necesaria para la distribución normal es difícil, pero afortunadamente hay diferentes aproximaciones de programación disponibles para calcular la integral de la distribución normal.
Sin embargo, las integrales conjuntas son más complicadas. La calculadora anterior estima una integral numérica (es decir, se resumen las probabilidades y las medias para diferentes X). Por lo tanto, el enfoque no es matemáticamente perfecto, pero supera con creces la precisión de una simulación de Monte Carlo para tiempos de cálculo similares. Para cualquier propósito práctico, esta calculadora es probablemente mucho más precisa que los datos que está ingresando en primer lugar. (¿Con qué precisión conoce la desviación estándar de sus procesos?)
En cuanto a los gráficos, Google proporciona una biblioteca de JavaScript bastante ingeniosa y gratuita para dichos gráficos (y muchas otras cosas).
¡Por supuesto, use todos los resultados bajo su propio riesgo! En cualquier caso, espero que esta herramienta te ayude a comprender mejor tu sistema. Ahora ¡Sal y mejora tu industria!.
google.load("visualization", "1", {packages: ["corechart"]});
var Mean1 = 5;
var Mean2 = 1;
var StDev1 = 10;
var StDev2 = 2;
var MinCoverage = 20;
var FiFoCVersion = "1.0";
var InputValid = true; // Input variables are valid and make sense
CalcResults() //for adding to wordpress
function CalcResults() {
// Button "Calculate the results was clicked
"use strict"; // all variables need to be declared
DynamicButton();
ReadData();
EstimateMaxProbFiFo();
StatisticalOutput();
drawExpectedTimeChart();
drawBNProbChart();
drawNormalChart();
}
function DynamicButton() {
// creates a dynamic button where WordPress will mes sit up
document.getElementById("DynamicButtonID").innerHTML = '
function ReadData() {
// Reads the data from the forms, also validates if these are valid numbers
var x = 0;
var VerifyText = "";
InputValid = true;
document.getElementById("ErrorMessage").innerHTML = "";
x = document.getElementById("fMean1").value;
if (isNaN(x) || x <= 0) {
VerifyText = "Input Mean Process 1 not valid. Needs to be a number larger than zero!
";
InputValid = false;
} else {Mean1 = Number(x)}
x = document.getElementById("fStDev1").value;
if (isNaN(x) || x < 0) {
VerifyText = VerifyText + "Input Standard Deviation Process 1 not valid. Needs to be a number larger or equal to zero!
";
InputValid = false;
} else {StDev1 = Number(x);}
x = document.getElementById("fMean2").value;
if (isNaN(x) || x <= 0 ) {
VerifyText = VerifyText + "Input Mean Process 2 not valid. Needs to be a number larger than zero!
";
InputValid = false;
} else {Mean2= Number(x);}
x = document.getElementById("fStDev2").value;
if (isNaN(x) || x < 0) {
VerifyText = VerifyText + "Input Standard Deviation Process 2 not valid. Needs to be a number larger or equal to zero!
";
InputValid = false;
} else {StDev2= Number(x);}
x = document.getElementById("TimeToCover").value;
if (isNaN(x) || x < 0 ) {
VerifyText = VerifyText + "Input Minimum Time to cover not valid. Needs to be a number larger than zero!
";
InputValid = false;
} else {MinCoverage= Number(x);}
if (InputValid == false) {
Mean1 =0;
StDev1 = 0;
Mean2 = 0;
StDev2 = 0;
document.getElementById("ErrorMessage").innerHTML = '
"Error!
"' + VerifyText + '';
}
}
function EstimateMaxProbFiFo() {
// Estimates the maximum FiFo length for which the bottleneck probability graph makes sense
// Get the size until the probability is below a threshold. Min size is 10.
// MaxFiFoCalc is a global variable
var MaxFiFoCalc = 30;
var ProbVal = 0;
var Threshold = 0.01;
var ContLoop = true;
var StepSize = 10; // Step size both for calculating the array size and for calculating the array
// First get the size until the probability is below a threshold. Min size is 10.
do {
ProbVal = ProbProc(MaxFiFoCalc, true);
if (Mean1 == Mean2) {
// Checks if the means are equal, in which case it will always be 0,5, no need to continue
ContLoop = false;
} else if (ProbVal 1-Threshold) {
// Probability below threshold, stop loop
ContLoop = false;
}
else if (MaxFiFoCalc > 100000000) {
// n approaching extremely very large numbers, stop loop
ContLoop = false;
}
else if (MaxFiFoCalc > 100) {
// n approaching large numbers, increase step size
StepSize = Math.round(MaxFiFoCalc/10);
}
MaxFiFoCalc = MaxFiFoCalc + StepSize; // Increase in step size
} while (ContLoop);
return MaxFiFoCalc;
}
function EstimateMaxTimeFiFo() {
// Estimates the maximum FiFo length for which the Expected Time probability graph makes sense
// Get the size until the probability is below a threshold. Min size is 10.
// MaxFiFoCalc is a global variable
var MaxFiFoCalc = 20;
var vCurrent = 0;
var StepSize = 10;
var Threshold = 0.001;
var vLast = CalcExpectedSystemCT(0); // Last overall time;
var PosLast =0; // Last fifo Length
var ContLoop = true;
// First get the size until the probability is below a threshold. Min size is 10.
do {
vCurrent = CalcExpectedSystemCT(MaxFiFoCalc);
if ((vLast - vCurrent)/(MaxFiFoCalc-PosLast) 10000) {
// n approaching extremely very large numbers, stop loop
ContLoop = false;
}
else if (MaxFiFoCalc > 100) {
// n approaching large numbers, increase step size
StepSize = Math.round(MaxFiFoCalc/10);
}
PosLast=MaxFiFoCalc;
vLast = vCurrent;
MaxFiFoCalc = MaxFiFoCalc + StepSize; // Increase in step size
} while (ContLoop);
return Math.round(MaxFiFoCalc);
}
function EstimateOptimalFifo() {
// Estimates the maximum FiFo length for which the Expected Time probability graph makes sense
// Get the size until the probability is below a threshold. Min size is 10.
// MaxFiFoCalc is a global variable
var MaxFiFoCalc = 0;
var vCurrent = CalcExpectedSystemCT(0);
var Threshold = 0.05;
var vLast = 0; // Last overall time;
var PosLast =0; // Last fifo Length
var ContLoop = true;
// First get the size until the probability is below a threshold. Min size is 10.
do {
PosLast = MaxFiFoCalc;
vLast = vCurrent;
MaxFiFoCalc++; // Increase in step size
vCurrent = CalcExpectedSystemCT(MaxFiFoCalc);
if ((vLast - vCurrent)/(MaxFiFoCalc-PosLast) 10001) {
// n approaching extremely very large numbers, stop loop
ContLoop = false;
}
} while (ContLoop);
MaxFiFoCalc--;
return Math.round(MaxFiFoCalc);
}
function StatisticalOutput(){
var StatText =""; // List of statistical information
var RecommendText = ""; // List of recommendations
var Tmp = 0;
// Calculates some statistics of the results
// The recommended FiFo Sizes
var MinFiFoVar = EstimateOptimalFifo();
var MinFiFoCover = Math.ceil(MinCoverage/Math.max(Mean1,Mean2));
RecommendText=RecommendText + '
RecommendText=RecommendText+"
RecommendText=RecommendText+"
// Quick info which process is the main bottleneck
if (Mean1 > Mean2) {
StatText=StatText+"
}
else if (Mean1 < Mean2) {
StatText=StatText+"
}
else {
StatText=StatText+"
}
// Likelihood for zero FiFo Length
Tmp = Math.round(100000*ProbProc(0, true)*100)/100000 + "%";
StatText=StatText+"
Tmp = Math.round(100000*(1-ProbProc(0, true))*100)/100000 + "%";
StatText=StatText+"
// Check Standard Deviation Sizes
if (StDev1== 0){
StatText=StatText+"
} else if (StDev1<Mean1/10){
Tmp = Math.round(1000*StDev1/Mean1*100)/1000 + "%";
StatText=StatText+"
}
if (StDev2== 0){
StatText=StatText+"
} else if (StDev2<Mean2/10){
Tmp = Math.round(1000*StDev2/Mean2*100)/1000 + "%";
StatText=StatText+"
}
//Checks for excessive large standard deviations more than 10x Mean
if (StDev1>5*Mean1){
StatText=StatText+"
}
if (StDev2>5*Mean2){
StatText=StatText+"
}
if (Math.max(Mean1, Mean2)/Math.min(Mean1, Mean2) >3){
StatText=StatText+"
}
//Adds the Mean and StDev for Debugging
StatText=StatText + "
// Add version Number
StatText=StatText + "
// Closing of the list and Output of the text
RecommendText = RecommendText +"";
StatText=StatText+"";
document.getElementById("RecommendationsOut").innerHTML = RecommendText;
document.getElementById("ObservationsOut").innerHTML = StatText;
}
function drawBNProbChart() {
// Draws the google chart for the probability of process A being the bottleneck
var data = CalcProbArray();
var options = {
title: 'Likelihood of being the Bottleneck',
hAxis: {
title: 'FiFo Size'},
vAxis: {
title: 'Bottleneck Probability',
format: '#%',
minValue: 0,
maxValue: 1},
legend: {position: 'top' },
isStacked: true,
curveType: 'function'
}
var chart = new google.visualization.AreaChart(document.getElementById('BNProbChart'));
chart.draw(data, options);
}
function CalcProbArray() {
var m = 0;
var o = 0;
var DataArray =[];
var vProb = 0;
var StepSize = 10; // Step size both for calculating the array size and for calculating the array
var MaxFiFoCalc = EstimateMaxProbFiFo();
// After calculating the size of the array, we now fill the array with data.
if (MaxFiFoCalc < 1000) {
StepSize = 1;
} else {
StepSize = Math.round(MaxFiFoCalc/1000);
}
o=0; // Array counter
for (m = 0; m Mean2) {
if (ProcA) {
Prob = 1;
} else {
Prob = 0;
}
} else if (Mean1<Mean2) {
if (ProcA) {
Prob = 0;
} else {
Prob = 1;
}
} else {
// equal means, no deviation, probability = 0.5
Prob = 0.5;
}
} else if (StDev3==0) {
if (Mean3 0) {
Prob=1-Prob;
}
Prob = Math.round(100000*Prob)/100000;
}
return Prob
}
function drawNormalChart() {
// Draws the google chart for the probability of process A being the bottleneck
var data = CalcNormalDistributionArray();
var options = {
title: 'Normal Distributions',
hAxis: {title: 'Time'},
vAxis: {
title: 'Probability Density Function',
minValue: 0},
legend: {position: 'top' },
curveType: 'function'
}
var chart = new google.visualization.LineChart(document.getElementById('DistributionChart'));
chart.draw(data, options);
}
function CalcNormalDistributionArray() {
var DataArray =[];
var vNumPoints = 1000;
var vMin = Math.min (Mean1 - 3 * StDev1 - Mean1/10 ,Mean2 - 3 * StDev2 - Mean2/10, 0);
var vMax = Math.max (Mean1 + 3 * StDev1 + Mean1/10 ,Mean2 + 3 * StDev2 + Mean1/10);
var vStep = (vMax - vMin) / vNumPoints;
var TmpArray = [];
for (i = 0; i < vNumPoints - 1; i++) {
DataArray[i] = [(vMin + i * vStep), (NormalBellCurve(Mean1, StDev1, vMin + i * vStep)), (NormalBellCurve(Mean2, StDev2, vMin + i * vStep))];
//DataArray[i] = [i, 0.5, 0.7];
}
if (StDev1 == 0) {
// Stdev is zero, need to increase a point
for (i = 0; i Mean1) {
TmpArray = DataArray[i];
TmpArray [1] = 1; // Make an artificial peak at the entry closest after x
DataArray[i] = TmpArray;
i = vNumPoints;
}
}
}
if (StDev2 == 0) {
// Stdev is zero, need to increase a point
for (i = 0; i Mean2) {
TmpArray = DataArray[i];
TmpArray [2] = 1; // Make an artificial peak at the entry closest after x
DataArray[i] = TmpArray;
i = vNumPoints;
}
}
}var gDataArray = new google.visualization.DataTable();
gDataArray.addColumn('number', 'X');
gDataArray.addColumn('number', 'PDF Process 1');
gDataArray.addColumn('number', 'PDF Process 2');
gDataArray.addRows(DataArray);
return gDataArray;
}
function NormalBellCurve(vMean, vStDev, vX) {
// Calculates the bell curve for the normal distribution
var vOut = 0;
vOut = - ((vX-vMean)*(vX-vMean))/(2*vStDev*vStDev);
vOut = Math.exp(vOut);
vOut = 1/(vStDev * Math.sqrt(2*Math.PI)) * vOut;
if (vStDev == 0) {
if (vX ==vMean) {
vOut = 1;
} else {
vOut = 0;
}
}
return vOut;
}
function drawExpectedTimeChart() {
// Draws the google chart for the expected average system time
var data = CalcExpectedTimeArray();
var options = {
title: 'Estimate of Time between Parts for System',
hAxis: {title: 'FiFo Size'},
vAxis: {
title: 'Time',
minValue: Math.floor(Math.max(Mean1, Mean2)*0.9)},
legend: {position: 'top' },
curveType: 'function'
}
var chart = new google.visualization.LineChart(document.getElementById('SystemTimeChart'));
chart.draw(data, options);
}
function CalcExpectedTimeArray() {
// Calculates the array with the expected system time depending on the size of the FiFo
var m = 0;
var o = 0;
var DataArray =[];
var MinTime = Math.max(Mean1, Mean2);
var StepSize = 10; // Step size both for calculating the array size and for calculating the array
var MaxFiFoCalc = EstimateMaxTimeFiFo(0.001, 10, 40);
// After calculating the size of the array, we now fill the array with data.
if (MaxFiFoCalc < 1000) {
StepSize = 1;
} else {
StepSize = Math.round(MaxFiFoCalc/1000);
}
o=0; // Array counter
for (m = 0; m Mean2) {
// Decides if we start with Process A (true) or Process B (false)
Mean3 = Mean1 * (FiFo + 1);
StDev3 = Math.sqrt(FiFo + 1) * StDev1;
Mean4 = Mean2 * (FiFo + 1);
StDev4 = Math.sqrt(FiFo + 1) * StDev2;
} else {
Mean4 = Mean1 * (FiFo + 1);
StDev4 = Math.sqrt(FiFo + 1) * StDev1;
Mean3 = Mean2 * (FiFo + 1);
StDev3 = Math.sqrt(FiFo + 1) * StDev2;
}
var vMin = Mean3 - 6 * StDev3;
var vMax = Mean3 + 6 * StDev3;
var ExpectedCT = 0;
var StepSize = (vMax - vMin) / (vNumPoints);
var tmpExp = 0;
var tmpProb = 0;
var tmpX = 0;
if (StDev3 == 0 && StDev4 ==0){
// Both StDevs are zero, larger one is expected CT
ExpectedCT = Math.max(Mean3, Mean4);
} else if (StDev3 == 0) {
// StDev1 is zero, in this case only one probability sample is needed
// How likely is the other process larger than the Mean3, and what is its expected value.
tmpProb = ProbPercentile(Mean4, StDev4, Mean3);
tmpExp = ExpectedValuePercentile(Mean4, StDev4, Mean3) * tmpProb;
ExpectedCT = tmpExp + Mean3 *(1-tmpProb);
} else if (StDev4 == 0) {
// StDev2 is zero2, in this case only one probability sample is needed
// How likely is the other process larger than the Mean3, and what is its expected value.
tmpProb = ProbPercentile(Mean3, StDev3, Mean3);
tmpExp = ExpectedValuePercentile(Mean3, StDev3, Mean3) * tmpProb;
ExpectedCT = tmpExp + Mean4 *(1-tmpProb);
}else {
// Calculate the integral manually
for (i = 0; i < vNumPoints; i++) {
tmpX = (i+0.5) * StepSize + vMin; //Current X- Position to calculate
tmpProb = ProbPercentile(Mean4, StDev4, tmpX); // Probability of the other Process being larger
tmpExp = ExpectedValuePercentile(Mean4, StDev4, tmpX) * tmpProb; //Expected Value of the other Process combined with Probability
tmpExp = tmpExp + tmpX *(1-tmpProb); //Expected first process combined with 1-Probability
tmpExp = tmpExp * NormalBellCurve(Mean3, StDev3, tmpX) * StepSize; //Combined with Likelihood of X appearing
ExpectedCT = ExpectedCT + tmpExp;
}
}
ExpectedCT = ExpectedCT/(FiFo + 1); // Adjusting for FiFO Length
return ExpectedCT;
}
function ExpectedValuePercentile(Mean3, StDev3, XVal) {
// calculates the expected value of the right hand percentile of process B above the value of x
// no reliable results for values very far to the right from the mean
var vMin = XVal;
var vMax = Math.max(Mean3 + 6 * StDev3, vMin + 2 * StDev3);
var vNumPoints = 100;
var ExpectedCT = 0;
var SumProb = 0;
var StepSize = (vMax - vMin)/vNumPoints;
var tmpX =0;
if ( vMin = Mean3 + 10 * StDev3) {
// X too far to the right, no sensible calculation possible. Take XVal as an estimate
ExpectedCT = XVal;
// Returns the XVal + the StDev as an approximation,
//this is highly inaccurate, but will be zeroed out in later calculations by a probability of 0
} else {
// Manually calculate the integral
for (evpN=0; evpN<vNumPoints; evpN++) {
// manually calculates the integral
tmpX = (evpN + 0.5) * StepSize + vMin;
SumProb = SumProb + NormalBellCurve(Mean3, StDev3, tmpX) * StepSize;
ExpectedCT = ExpectedCT + NormalBellCurve(Mean3, StDev3, tmpX) * StepSize * tmpX;
}
ExpectedCT=(ExpectedCT/SumProb);
}
return ExpectedCT;
}
function ProbPercentile(Mean3, StDev3, XVal) {
// Calculates the likelihood of process b having a time in the upper percentile above x
// First step calculated the distribution of the difference.
// Source: http://www.math.ucla.edu/~tom/distributions/normal.html
// Checked with excel, very accurate
if (StDev3 < 0) {
alert("The standard deviation must be nonnegative.");
} else if (StDev3==0) {
// With zero Standard Deviation, the probability depends only on the mean.
if (Mean3 = 8) {
// Too far out to the right, probability is one
Prob = 1;
} else if ( X 0) {
Prob=1-Prob;
}
}
}
return 1-Prob ;
}
//
CalcResults()
// ]]>
Entradas Relacionadas