
Gage Repeatability and Reproducibility Excel Spreadsheet Calculator

The Gage Repeatability and Reproducibility (R&R) Excel spreadsheet calculator is a valuable tool for quality control engineers and professionals. This calculator helps to assess the variation in a measurement system, ensuring that the data collected is reliable and accurate. By using this calculator, users can evaluate the repeatability and reproducibility of their measurement system, identifying potential sources of error and improving overall quality control processes. The calculator provides a straightforward and efficient way to analyze data, making it an essential resource for industries that rely on precise measurements. It saves time and increases precision.
- Gage Repeatability and Reproducibility Excel Spreadsheet Calculator: A Comprehensive Tool for Quality Control
- How do you calculate repeatability in Excel?
- Can I do a gage R&R in Excel?
- How do you calculate repeatability and reproducibility?
-
Frequently Asked Questions (FAQs)
- What is the purpose of the Gage Repeatability and Reproducibility Excel Spreadsheet Calculator?
- How does the Gage Repeatability and Reproducibility Excel Spreadsheet Calculator work?
- What are the benefits of using the Gage Repeatability and Reproducibility Excel Spreadsheet Calculator?
- How can the Gage Repeatability and Reproducibility Excel Spreadsheet Calculator be used in different industries?
Gage Repeatability and Reproducibility Excel Spreadsheet Calculator: A Comprehensive Tool for Quality Control
The Gage Repeatability and Reproducibility (GRR) Excel spreadsheet calculator is a powerful tool used in quality control to assess the accuracy and precision of measurement systems. It is widely used in various industries, including manufacturing, engineering, and research, to evaluate the performance of measurement instruments and ensure that they are producing reliable and consistent results.
Introduction to Gage Repeatability and Reproducibility
Gage Repeatability and Reproducibility is a statistical method used to evaluate the variation in measurement results obtained from different operators, equipment, and environments. It involves conducting a series of experiments to measure the repeatability and reproducibility of a measurement system, which are then used to calculate the GRR value. The GRR value represents the percentage of variation in the measurement results that can be attributed to the measurement system itself, rather than other factors.
How to Use the GRR Excel Spreadsheet Calculator
The GRR Excel spreadsheet calculator is a user-friendly tool that requires minimal training and expertise to use. To use the calculator, simply enter the measurement data into the spreadsheet, and the calculator will calculate the GRR value and other statistics, such as the mean, standard deviation, and coefficient of variation. The calculator also provides a graphical representation of the data, making it easy to visualize the results and identify any trends or patterns.
| GRR Value | Interpretation |
|---|---|
| < 10% | Acceptable level of variation |
| 10-20% | Marginal level of variation |
| > 20% | Unacceptable level of variation |
Benefits of Using the GRR Excel Spreadsheet Calculator
The GRR Excel spreadsheet calculator offers several benefits, including improved accuracy, increased efficiency, and enhanced decision-making. By using the calculator, organizations can reduce errors, minimize variability, and optimize their measurement systems. The calculator also provides a cost-effective solution for evaluating measurement systems, as it eliminates the need for expensive and time-consuming experiments.
Common Applications of the GRR Excel Spreadsheet Calculator
The GRR Excel spreadsheet calculator has a wide range of applications, including quality control, research and development, and regulatory compliance. It is commonly used in industries such as aerospace, automotive, and medical devices, where precision and accuracy are critical. The calculator is also used in academic and research settings to evaluate the reliability and validity of measurement instruments.
Best Practices for Using the GRR Excel Spreadsheet Calculator
To ensure accurate and reliable results, it is essential to follow best practices when using the GRR Excel spreadsheet calculator. These include properly calibrating the measurement instrument, selecting a representative sample of data, and avoiding biases and errors. It is also important to document the results and store them in a secure location, such as a database or spreadsheet. By following these best practices, organizations can ensure that their measurement systems are reliable, consistent, and accurate.
How do you calculate repeatability in Excel?

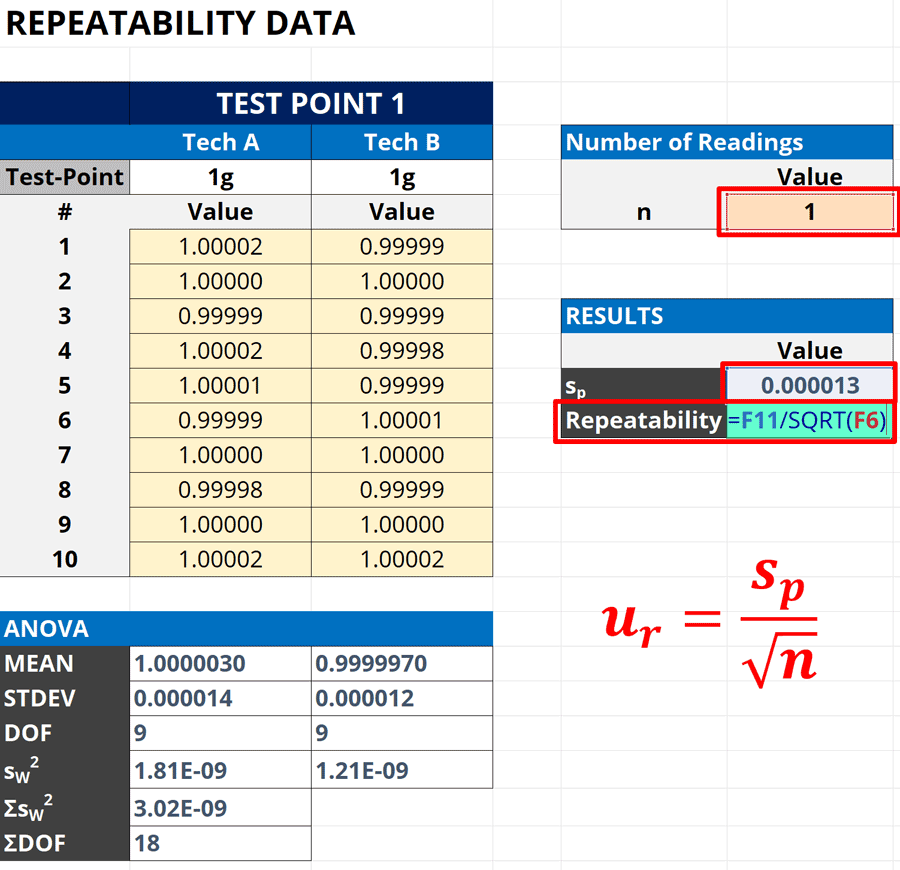
To calculate repeatability in Excel, you can use various methods, including the Gauge Repeatability and Reproducibility (GRR) study. This method involves calculating the variation in measurements obtained by multiple operators or instruments. The first step is to collect data on the measurements, including the average and range of values. Then, you can use formulas and functions in Excel to calculate the repeatability and reproducibility of the measurements.
Understanding Repeatability in Excel
Repeatability in Excel refers to the ability of a measurement system to produce consistent results when measuring the same characteristic under the same conditions. To calculate repeatability, you need to understand the concepts of precision and accuracy. Precision refers to the closeness of individual measurements to each other, while accuracy refers to the closeness of the average measurement to the true value. The following steps can help you calculate repeatability in Excel:
- Collect data on the measurements, including the average and range of values.
- Use formulas and functions in Excel to calculate the standard deviation of the measurements.
- Calculate the repeatability using the GRR formula, which is based on the standard deviation and the number of trials.
Using Formulas and Functions to Calculate Repeatability
To calculate repeatability in Excel, you can use various formulas and functions, including the STDEV function to calculate the standard deviation and the AVERAGE function to calculate the average measurement. You can also use the VAR function to calculate the variance of the measurements. The following steps can help you use formulas and functions to calculate repeatability:
- Use the STDEV function to calculate the standard deviation of the measurements.
- Use the AVERAGE function to calculate the average measurement.
- Use the VAR function to calculate the variance of the measurements.
Applying the Gauge Repeatability and Reproducibility (GRR) Study
The GRR study is a widely used method for calculating repeatability and reproducibility in manufacturing and testing applications. The study involves calculating the variation in measurements obtained by multiple operators or instruments. The following steps can help you apply the GRR study:
- Collect data on the measurements, including the average and range of values.
- Calculate the standard deviation of the measurements using the STDEV function.
- Calculate the repeatability using the GRR formula, which is based on the standard deviation and the number of trials.
Interpreting Repeatability Results in Excel
Once you have calculated the repeatability in Excel, you need to interpret the results to determine the precision and accuracy of the measurement system. The repeatability results can help you identify sources of variation and take corrective action to improve the measurement system. The following steps can help you interpret repeatability results:
- Compare the repeatability results to the specification limits to determine if the measurement system is capable of producing accurate results.
- Use control charts to monitor the measurement system and detect any trends or patterns in the data.
- Take corrective action to address any sources of variation and improve the measurement system.
Using Repeatability to Improve Measurement Systems
Repeatability is an important metric for evaluating the performance of measurement systems. By calculating repeatability in Excel, you can identify areas for improvement and take action to increase the precision and accuracy of the measurement system. The following steps can help you use repeatability to improve measurement systems:
- Use repeatability results to identify sources of variation and take corrective action to address them.
- Implement quality control procedures to monitor the measurement system and detect any trends or patterns in the data.
- Use statistical methods to analyze the data and identify opportunities for improvement.
Can I do a gage R&R in Excel?
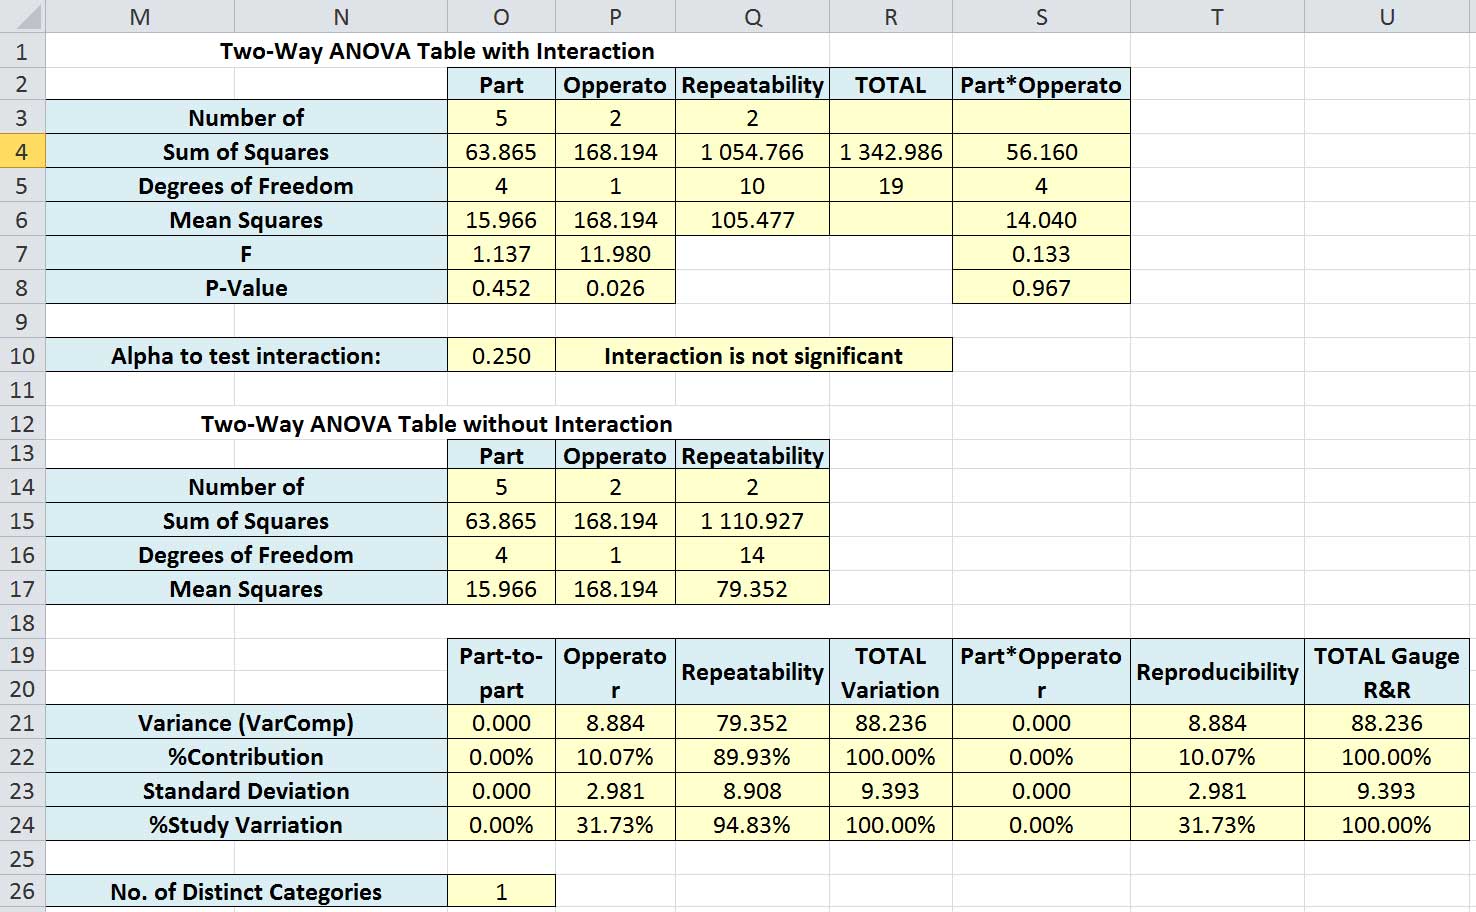
Yes, you can perform a Gage R&R (Gage Repeatability and Reproducibility) study in Excel using various methods and tools. One common approach is to use the ANOVA (Analysis of Variance) function to analyze the data and calculate the variance components. You can also use add-ins such as XLSTAT or SigmaXL to simplify the process.
Introduction to Gage R&R in Excel
Performing a Gage R&R study in Excel requires a good understanding of the statistical concepts involved. The study evaluates the repeatability and reproducibility of a measurement system, which is essential in quality control and engineering applications. To perform a Gage R&R study in Excel, you need to:
- Collect data on the measurements taken by multiple operators using the same gage
- Calculate the mean and variance of the measurements for each operator
- Use ANOVA to calculate the variance components and determine the repeatability and reproducibility of the measurement system
Using ANOVA for Gage R&R in Excel
The ANOVA function in Excel can be used to analyze the data and calculate the variance components. You can use the ANOVA function to:
- Calculate the sum of squares and mean square for the operators and measurements
- Determine the F-statistic and p-value to evaluate the significance of the variance components
- Calculate the repeatability and reproducibility of the measurement system using the variance components
Interpreting Gage R&R Results in Excel
Interpreting the results of a Gage R&R study in Excel requires a good understanding of the statistical concepts involved. The results provide insights into the repeatability and reproducibility of the measurement system, which can be used to:
- Identify the sources of variation in the measurement system
- Determine the accuracy and precision of the measurements
- Implement improvements to the measurement system to reduce variation and improve repeatability and reproducibility
Limitations of Gage R&R in Excel
While Excel can be used to perform a Gage R&R study, there are some limitations to consider. The limitations include:
- Limited statistical capabilities compared to specialized software
- Requires a good understanding of statistical concepts and data analysis
- May not provide detailed reports or visualizations of the results
Alternatives to Gage R&R in Excel
If you need more advanced or specialized Gage R&R capabilities, you may want to consider alternatives to Excel. Some alternatives include:
- Minitab: A statistical software that provides advanced Gage R&R capabilities and reporting tools
- JMP: A statistical software that provides advanced Gage R&R capabilities and data visualization tools
- SigmaXL: An add-in for Excel that provides advanced Gage R&R capabilities and reporting tools
How do you calculate repeatability and reproducibility?
To calculate repeatability and reproducibility, you need to understand the concepts of precision, accuracy, and variability. Repeatability refers to the ability of a measurement system to produce consistent results when the same measurement is repeated under the same conditions, while reproducibility refers to the ability of a measurement system to produce consistent results when the same measurement is repeated under different conditions. Calculating these values involves analyzing the data collected from repeated measurements and using statistical methods to quantify the variability and bias in the measurements.
Understanding Repeatability
Repeatability is a measure of the consistency of a measurement system when the same measurement is repeated under the same conditions. To calculate repeatability, you need to collect data from repeated measurements and calculate the standard deviation of the measurements. This can be done using the following steps:
- Collect data from repeated measurements under the same conditions
- Calculate the mean of the measurements
- Calculate the standard deviation of the measurements
This will give you a measure of the repeatability of the measurement system, which can be used to determine the precision of the measurements.
Understanding Reproducibility
Reproducibility is a measure of the consistency of a measurement system when the same measurement is repeated under different conditions. To calculate reproducibility, you need to collect data from repeated measurements under different conditions and calculate the standard deviation of the measurements. This can be done using the following steps:
- Collect data from repeated measurements under different conditions
- Calculate the mean of the measurements
- Calculate the standard deviation of the measurements
This will give you a measure of the reproducibility of the measurement system, which can be used to determine the accuracy of the measurements.
Calculating Repeatability and Reproducibility
To calculate repeatability and reproducibility, you can use the following statistical methods:
- Analysis of variance (ANOVA): This method is used to calculate the variability in the measurements and determine the significance of the differences between the measurements
- Regression analysis: This method is used to calculate the relationship between the measurements and determine the accuracy of the measurements
- Descriptive statistics: This method is used to calculate the mean, median, and standard deviation of the measurements and determine the precision of the measurements
These methods can be used to calculate the repeatability and reproducibility of a measurement system and determine the accuracy and precision of the measurements.
Importance of Repeatability and Reproducibility
Repeatability and reproducibility are critical components of any measurement system, as they determine the accuracy and precision of the measurements. Repeatability is important because it ensures that the measurements are consistent and reliable, while reproducibility is important because it ensures that the measurements are accurate and valid. The following are some of the reasons why repeatability and reproducibility are important:
- Ensures accuracy: Repeatability and reproducibility ensure that the measurements are accurate and valid
- Ensures precision: Repeatability and reproducibility ensure that the measurements are precise and reliable
- Builds trust: Repeatability and reproducibility build trust in the measurement system and the results
This is why repeatability and reproducibility are essential components of any measurement system.
Challenges in Calculating! Repeatability and Reproducibility
Calculating repeatability and reproducibility can be challenging, especially in complex systems with many variables. Some of the challenges include:
- Complexity: Complex systems with many variables can make it difficult to calculate repeatability and reproducibility
- Noise: Noise in the system can make it difficult to calculate repeatability and reproducibility
- Variability: Variability in the system can make it difficult to calculate repeatability and reproducibility
To overcome these challenges, it is essential to use robust statistical methods and to carefully design the experiment to minimize noise and variability.
Frequently Asked Questions (FAQs)
What is the purpose of the Gage Repeatability and Reproducibility Excel Spreadsheet Calculator?
The Gage Repeatability and Reproducibility (R&R) Excel Spreadsheet Calculator is a tool designed to help organizations evaluate the accuracy and reliability of their measurement systems. The primary purpose of this calculator is to determine the variability of measurements obtained from a gage or measuring instrument, and to assess the repeatability and reproducibility of these measurements. By using this calculator, organizations can identify potential issues with their measurement systems, such as operator error or instrument calibration problems, and take corrective action to improve the quality of their measurements. The calculator uses statistical methods to analyze the data and provide a comprehensive report on the performance of the measurement system.
How does the Gage Repeatability and Reproducibility Excel Spreadsheet Calculator work?
The Gage R&R Excel Spreadsheet Calculator works by using a step-by-step approach to guide the user through the data collection and analysis process. First, the user must collect data on the measurements obtained from the gage or measuring instrument, including the part number, operator, and measurement value. The user then enters this data into the calculator, which uses formulas and algorithms to analyze the data and calculate the repeatability and reproducibility of the measurements. The calculator also provides a graphical representation of the data, allowing the user to visualize the variability of the measurements and identify potential trends or patterns. The calculator then provides a summary report that includes the results of the analysis, including the %R&R value, which indicates the percentage of variability in the measurements that is due to the gage or measuring instrument.
What are the benefits of using the Gage Repeatability and Reproducibility Excel Spreadsheet Calculator?
The Gage R&R Excel Spreadsheet Calculator provides several benefits to organizations that use it to evaluate their measurement systems. One of the main benefits is that it helps to improve the accuracy and reliability of measurements, which is critical in many industries, such as manufacturing and engineering. By identifying potential issues with the measurement system, organizations can take corrective action to improve the quality of their measurements, which can lead to increased efficiency and reduced costs. The calculator also provides a standardized approach to evaluating measurement systems, which can help to reduce variability and improve consistency across different locations and operators. Additionally, the calculator provides a detailed report that can be used to document the results of the analysis, which can be useful for auditing and compliance purposes.
How can the Gage Repeatability and Reproducibility Excel Spreadsheet Calculator be used in different industries?
The Gage R&R Excel Spreadsheet Calculator can be used in a variety of industries, including manufacturing, engineering, quality control, and research and development. In manufacturing, the calculator can be used to evaluate the accuracy and reliability of measurements obtained from inspection equipment, such as calipers and micrometers. In engineering, the calculator can be used to evaluate the performance of sensors and transducers used in data acquisition systems. In quality control, the calculator can be used to evaluate the effectiveness of quality control processes, such as inspection and testing. In research and development, the calculator can be used to evaluate the accuracy and reliability of measurements obtained from experiments and tests. The calculator can also be used in other industries, such as aerospace, automotive, and medical devices, where precise measurements are critical to product quality and safety.
Deja una respuesta
Entradas Relacionadas